
Hello again, everyone! Since I wrote my last blog post, there has been a new version of anvi’o released with many new and useful capabilities. Two of these I found most helpful in my own work, so I will talk about them here. Both of these apply to pangenomes, so you must have already run anvi-pan-genome before doing anything here. See my original blog post for the pangenomic workflow.
Average nucleotide identity (ANI)
The new command anvi-compute-ani calculates average nucleotide identity (ANI) of the genomes in your pangenome. ANI is essentially a measure of how similar two genomes are at the nucleotide level. The higher an ANI between two genomes, the more closely related they are. To calculate ANI for the genomes in your pangenome, run the following in your terminal:
anvi-compute-ani –external-genomes /home/mkh/external_genomes.txt –output-dir /home/mkh/ANI/ –num-threads 20 –pan-db /home/mkh/Thiomonas_isolate_pan/THIOMONAS_ISOLATES-PAN.db
–external-genomes: You must provide the external genomes text file you used when you created your genomes storage with anvi-gen-genomes-storage.
–output-dir: The directory (folder) ANI will be created for you, so you must specify the file path where you want anvi’o to place the new directory.
You are not actually required to provide the pan database you created with anvi-pan-genome, but if you choose to include the –pan-db flag, you can add the results of the ANI computation to the pan database as additional layer data. If you visualize the pangenome again (with anvi-display-pan) after running anvi-compute-ani, you will not see anything different at first. You will have to go to the ‘layers’ tab and check the box for ‘ANI_percentage_identity’. Then click the ‘Draw’ button, and you will see something like this:
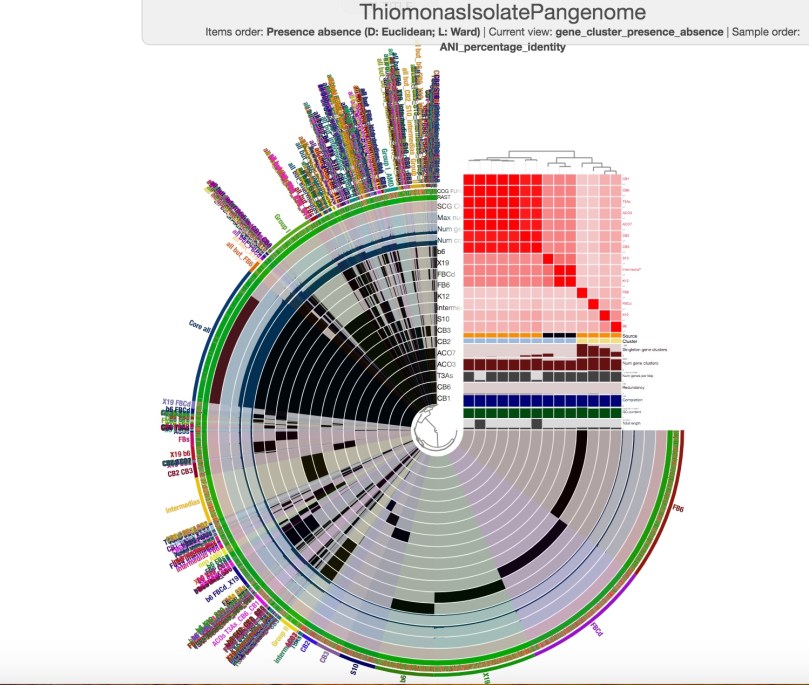
You may have to go to ‘Order by’ and select ‘ANI_percentage_identity (tree)’ to see your ANI data in an order that helps you visualize how closely related your genomes are (remember to click ‘Draw’ again after this).
When you summarize your pangenome with anvi-summarize, one of the output files you will generate will be a text file, ANI_percentage_identity.txt, that contains the numerical information that is displayed in the graph above.
Functional enrichment analysis
Anvi’o’s new program anvi-get-enriched-functions-per-pan-group allows you to determine which functions are characteristic of any given group of your genomes relative to the rest. Essentially, you divide your genomes into two or more groups (with anvi-import-misc-data) and use anvi-ger-enriched-functions-per-pan-group to determine which functions are enriched for each group relative to all the rest combined. This can be done using any of the functional annotation sources you have available, and can be run more than once if you want to do the analysis using more than one annotation source.
To assign your genomes to groups, run anvi-import-misc-data:
anvi-import-misc-data TAB-DELIMITED-FILE -p /home/mkh/Thiomonas_isolate_pan/THIOMONAS_ISOLATES-PAN.db -t layers
-t layers: see here
The tab-delimited text file you must provide at this step contains the information on which groups you are assigning your genomes to:
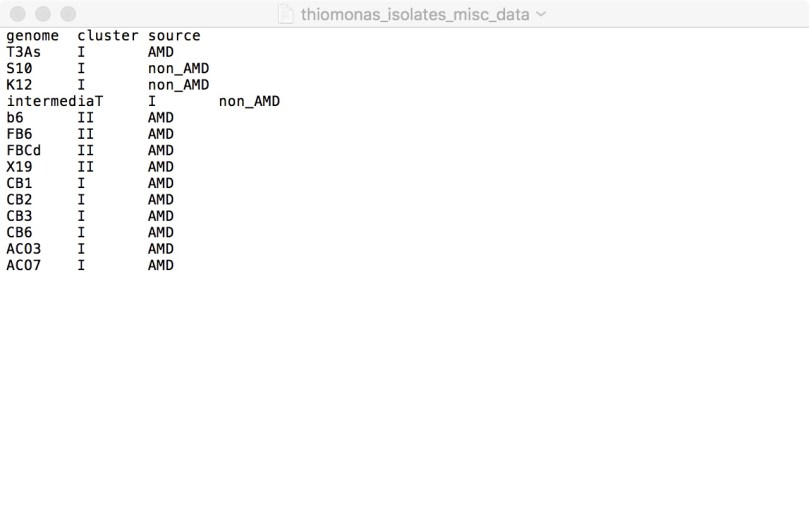
You may assign them to groups based on taxonomic classification, phylogenetic tree groupings, isolation sites, or anything you like, depending on the question(s) you are trying to answer. When you visualize the pangenome again after this, it should become part of your layers data that appears in the top right corner of the figure.
Next, we run anvi-get-enriched-functions-per-pan-group:
anvi-get-enriched-functions-per-pan-group -p /home/mkh/Thiomonas_isolate_pan/THIOMONAS_ISOLATES-PAN.db -g /home/mkh/THIOMONAS-GENOMES.db –category-variable cluster –annotation-source COG_FUNCTION ct –functional-occurrence-table-output /home/mkh/Thiomonas_enriched_functions/Thiomonas_COG_occurrence.txt
You need to provide the pan database and the genomes storage with -p and -g respectively (remember to include the file path).
–category-variable specifies the category of groups to be used in this analysis, which is simply the column header in the text file you provided to anvi-import-misc-data. In this example, ‘–category-variable cluster’ specifies the ‘cluster’ column in the text file, which divides the genomes into groups I and II. Running the command as written above would conduct the functional enrichment analysis for genomes in group I vs group II.
-o /home/mkh/Thiomonas_enriched_functions/Thiomonas_COG_functions_cluster.txt will generate the text file to which the results of the analysis will go. There are 14 columns in the text file: category, COG_FUNCTION (or whichever annotation source you specified), enrichment_score, weighted_enrichment_score, portion_occurrence_in_group, portion_occurrence_outside_of_group, occurrence_in_group, occurrence_outside_of_group, gene_cluster_ids, core_in_group, core, wilcoxon_p_value, wilcoxon_statistic, wilcoxon_corrected_p_value. The meaning of each column is described here (scroll down).
–functional-occurrence-table-output is an optional text file output that is simply a presence/absence table of each function in each genome. I highly recommend doing this, as it is very useful information to have. There are instructions here for visualizing the functional pangenome using the functional occurrence table, but it’s actually much more difficult than it looks and I never made it past the fourth step, for technical reasons that are beyond my comprehension. You are welcome to attempt it if you wish, and please let me know how you achieved it, so that I can post it here and actually make it clear what you’re supposed to do and how you’re supposed to do it.
If you have any questions regarding anything in this tutorial, please feel free to let me know!
